One Observability Demo
Introduction to AWS Observability
Recently I worked through this workshop to go over native monitoring and logging. If you want to get a look at CloudWatch ServiceLens or X-Ray this workshop is a good place to start. It will also give you a look at Contributor Insights, Container Insights, Logs Insights, Lambda Insights, Synthetics, Anomaly Detection, Alarms, Metrics, and Dashboards. Three newer sections include Amazon Managed Service for Prometheus, Amazon Managed Service for Grafana, and AWS Distro for OpenTelemetry.
The steps to deploy the sample application is fairly simple. There are step by step instructions to deploy using Cloud9 and the AWS CDK. Once the application is finished you can view the shop and start generating traffic to view in the traces. Each section will allow you to explore how to use the different features.
WARNING
One thing to keep in mind is this workshop will cost money. Be sure to clean up and not leave it running.
Note
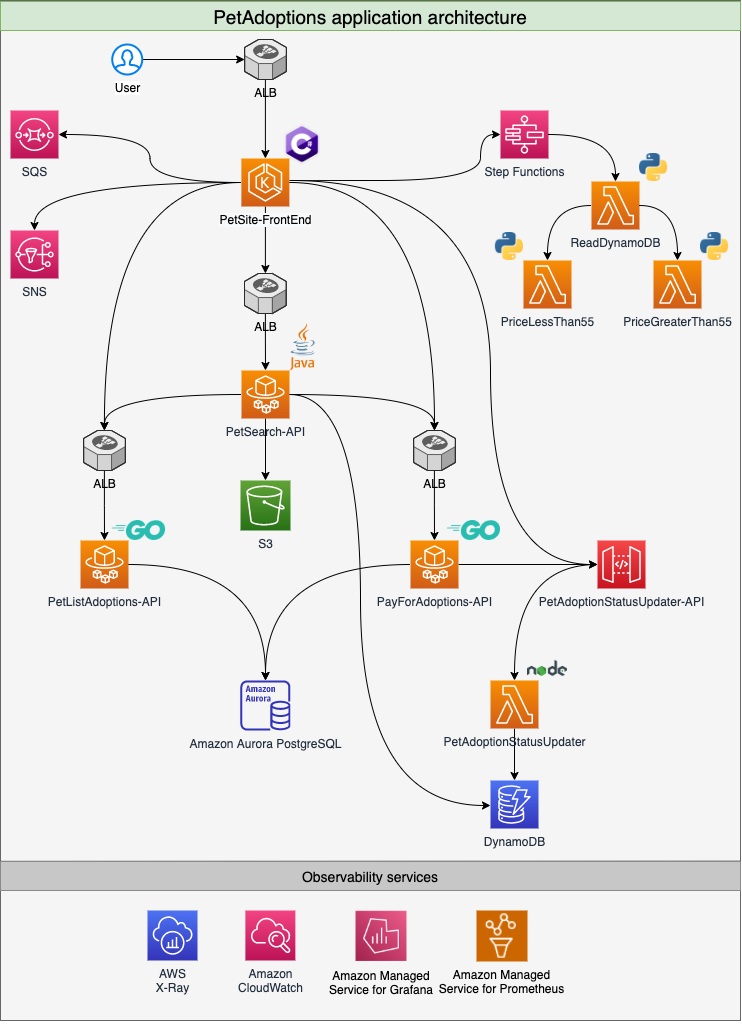
Image is from the Demo workshop